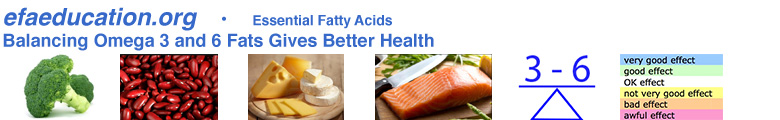
Omega 3-6 Balance Scores combine data on eleven different EFA into a single number for each food item. Foods with more positive scores give a higher omega-3 balance for your health risk assessment biomarker, whereas those with more negative ones give a higher omega-6 balance for your body. You can use Omega 3 minus 6 Scores while shopping, planning meals or talking about foods with friends. Scores for different types of food are listed below.
A negative shift often occurs in the omega 3-6 balance score when a food is prepared/processed with various food oils. For example potatoes, cabbages and onions have balanced scores near 0, but scores for potato salad (-21), coleslaw (-26) and fried onion rings (-9) are more negative than that for the average USA diet (-6). Also, steamed shrimp (+4) differ from the breaded, fried shrimp (-22) in a restaurant. Wheat flour (-1) is a major food item that is processed with oils to make wheat bran muffins (-13) and blueberry muffins (-18).
To NIX6 and EAT3, scan the lists below to see how “real” foods and prepared/processed foods differ.
Click links below to see Scores (and averages) for the foods in different groups.
Cereals, grains & pasta ( -3)
Breakfast cereals ( -3)
Baked products ( -6)
Vegetables ( -2) Foliage usually has balanced omega-3 and omega-6.
Fruits & juices ( -1)
Dairy & egg ( -2)
Poultry Products ( -11)
Pork Products ( -7)
Beef Products ( -3)
Lamb,Veal&Game ( -5)
Sausage & LunchMeats ( -7)
Legumes ( -9)
Fish & Seafood ( +30) Many seafoods have rich supplies of omega-3 HUFA!
Nuts & Seed Products ( -18) Many nuts and seeds have more omega-6 than omega-3.
Fats & Oils ( -21) Many oils from seeds have more omega-6 than omega-3.
Soups, Sauces&Gravies ( -5)
Snacks ( -12)
Fast Foods ( -8)
Meals & Entrees ( -5)
Restaurant Foods ( -12)
Sweets (-3)
Beverages ( -1)
Spices & Herbs ( -2)
Baby Foods ( -6)
[ These average values were published in 2012.]